
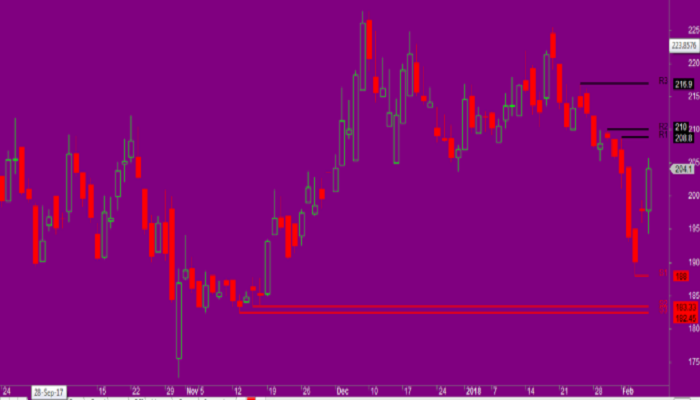
Support Resistant for Amibroker AFL –
Support Resistant for Amibroker AFL is saying everything, Formula for intraday traders. But i would say that this afl for all those people who want to trade again n again n again daily for small profits, that means this afl formula is for scalpers. So see first trend in max timeframes, and trade on that . for small profits with small stoploss. So scalp the trend with the formula.
HERE IS THE Support Resistant for Amibroker AFL
|
1 2 3 4 5 6 7 8 9 10 11 12 13 14 15 16 17 18 19 20 21 22 23 24 25 26 27 28 29 30 31 32 33 34 35 36 37 38 39 40 41 42 43 44 45 46 47 48 49 50 51 52 53 54 55 56 57 58 59 60 61 62 63 64 65 66 67 68 69 70 71 72 73 74 75 76 77 78 79 80 81 82 83 84 85 86 87 88 89 90 91 92 93 94 95 96 97 98 99 100 101 102 103 104 105 106 107 108 109 110 111 112 113 114 115 116 117 118 119 120 121 122 123 124 125 126 127 128 129 130 131 132 133 134 135 136 |
_SECTION_BEGIN("Price"); SetChartOptions(0,chartShowArrows|chartShowDates); _N(Title = StrFormat("{{NAME}} - {{INTERVAL}} {{DATE}} Open %g, Hi %g, Lo %g, Close %g (%.1f%%) {{VALUES}}", O, H, L, C, SelectedValue( ROC( C, 1 ) ) )); Plot( C, "Close", ParamColor("Color", colorDefault ), styleNoTitle | ParamStyle("Style") | GetPriceStyle() ); _SECTION_END(); _SECTION_BEGIN("SupportResistance"); // START SCRIPT UNTUK SUPPORT / RESISTANT WarnaResistant = ParamColor("Warna Garis Resistant",colorBlack); WarnaSupport = ParamColor("Warna Garis Support",colorRed); R1_show = 0; S1_show = 0; SRStyle = ParamStyle("S/R Style",styleThick); if (ParamToggle("Garis Support&Resistance", "Tidak|Ya", 1 )) { // RESISTANT LastHighestValue = LastVisibleValue(Ref(H,-1)); if (LastVisibleValue(H) == H[LastValue(BarIndex())]) LastHighestValue = LastVisibleValue(H); i = 1; if (LastHighestValue < HighestVisibleValue(H)) { while (LastVisibleValue(ValueWhen(H <= Ref(H,-1) AND Ref(H,-2) <= Ref(H, -1),Ref(H, -1), i)) < LastHighestValue) i++; R1 = LastVisibleValue(ValueWhen(H <= Ref(H,-1) AND Ref(H,-2) <= Ref(H, -1),Ref(H, -1), i)); R1x = LastVisibleValue(ValueWhen(H <= Ref(H,-1) AND Ref(H,-2) <= Ref(H, -1),Ref(BarIndex(), -1), i)); Plot(IIf(BarIndex() >= R1x,LastValue(R1),Null),"R1",WarnaResistant ,SRStyle); PlotText("R1 : " + R1, BarCount + 1, LastValue(R1), WarnaResistant); R1_show = 1; i++; if (HighestVisibleValue( H ) > R1) { while (LastVisibleValue(ValueWhen(H <= Ref(H,-1) AND Ref(H,-2) <= Ref(H, -1), Ref(H,-1), i)) <= R1) i++; R2 = LastVisibleValue(ValueWhen(H <= Ref(H,-1) AND Ref(H,-2) <= Ref(H, -1), Ref(H,-1), i)); R2x = LastVisibleValue(ValueWhen(H <= Ref(H,-1) AND Ref(H,-2) <= Ref(H, -1),Ref(BarIndex(), -1), i)); Plot(IIf(BarIndex() >= R2x,LastValue(R2),Null),"R2",WarnaResistant ,SRStyle); PlotText("R2 : " + R2, BarCount + 1, LastValue(R2), WarnaResistant); i++; if (HighestVisibleValue( H )> R2) { while (LastVisibleValue(ValueWhen(H <= Ref(H,-1) AND Ref(H,-2) <= Ref(H, -1), Ref(H,-1), i)) <= R2) i++; R3 = LastVisibleValue(ValueWhen(H <= Ref(H,-1) AND Ref(H,-2) <= Ref(H, -1), Ref(H,-1), i)); R3x = LastVisibleValue(ValueWhen(H <= Ref(H,-1) AND Ref(H,-2) <= Ref(H, -1),Ref(BarIndex(), -1), i)); Plot(IIf(BarIndex() >= R3x,LastValue(R3),Null),"R3",WarnaResistant ,SRStyle); PlotText("R3 : " + R3, BarCount + 1, LastValue(R3), WarnaResistant); } } } else if (LastHighestValue == HighestVisibleValue(H)) { R1 = LastVisibleValue(ValueWhen(H <= Ref(H,-1) AND Ref(H,-2) <= Ref(H, -1),Ref(H, -1), i)); R1x = LastVisibleValue(ValueWhen(H <= Ref(H,-1) AND Ref(H,-2) <= Ref(H, -1),Ref(BarIndex(), -1), i)); if (R1 == LastHighestValue) { Plot(IIf(BarIndex() >= R1x,LastValue(R1),Null),"R1",WarnaResistant ,SRStyle); PlotText("R1 : " + R1, BarCount + 1, LastValue(R1), WarnaResistant); R1_show = 1; } } // SUPPORT LastLowestValue = LastVisibleValue(Ref(L,-1)); if (LastVisibleValue(L) == L[LastValue(BarIndex())]) LastLowestValue = LastVisibleValue(L); i = 1; if (LastLowestValue > LowestVisibleValue(L)) { while (LastVisibleValue(ValueWhen(L >= Ref(L,-1) AND Ref(L,-2) >= Ref(L, -1),Ref(L, -1), i)) > LastLowestValue) i++; S1 = LastVisibleValue(ValueWhen(L >= Ref(L,-1) AND Ref(L,-2) >= Ref(L, -1),Ref(L, -1), i)); S1x = LastVisibleValue(ValueWhen(L >= Ref(L,-1) AND Ref(L,-2) >= Ref(L, -1),Ref(BarIndex(), -1), i)); Plot(IIf(BarIndex() >= S1x,LastValue(S1),Null),"S1",WarnaSupport ,SRStyle); PlotText("S1 : " + S1, BarCount + 1, LastValue(S1), WarnaSupport); S1_show = 1; i++; if (LowestVisibleValue( L ) < S1) { while (LastVisibleValue(ValueWhen(L >= Ref(L,-1) AND Ref(L,-2) >= Ref(L, -1), Ref(L,-1), i)) >= S1) i++; S2 = LastVisibleValue(ValueWhen(L >= Ref(L,-1) AND Ref(L,-2) >= Ref(L, -1), Ref(L,-1), i)); S2x = LastVisibleValue(ValueWhen(L >= Ref(L,-1) AND Ref(L,-2) >= Ref(L, -1), Ref(BarIndex(),-1), i)); Plot(IIf(BarIndex() >= S2x,LastValue(S2),Null),"S2",WarnaSupport ,SRStyle); PlotText("S2 : " + S2, BarCount + 1, LastValue(S2), WarnaSupport); i++; if (LowestVisibleValue( L )< S2) { while (LastVisibleValue(ValueWhen(L >= Ref(L,-1) AND Ref(L,-2) >= Ref(L, -1), Ref(L,-1), i)) >= S2) i++; S3 = LastVisibleValue(ValueWhen(L >= Ref(L,-1) AND Ref(L,-2) >= Ref(L, -1), Ref(L,-1), i)); S3x = LastVisibleValue(ValueWhen(L >= Ref(L,-1) AND Ref(L,-2) >= Ref(L, -1), Ref(BarIndex(),-1), i)); Plot(IIf(BarIndex() >= S3x,LastValue(S3),Null),"S3",WarnaSupport ,SRStyle); PlotText("S3 : " + S3, BarCount + 1, LastValue(S3), WarnaSupport); } } } else if (LastLowestValue == LowestVisibleValue(L)) { S1 = LastVisibleValue(ValueWhen(L >= Ref(L,-1) AND Ref(L,-2) >= Ref(L, -1),Ref(L, -1), i)); S1x = LastVisibleValue(ValueWhen(L >= Ref(L,-1) AND Ref(L,-2) >= Ref(L, -1),Ref(BarIndex(), -1), i)); if (S1 == LastLowestValue) { Plot(IIf(BarIndex() >= S1x,LastValue(S1),Null),"S1",WarnaSupport ,SRStyle); PlotText("S1 : " + S1, BarCount + 1, LastValue(S1), WarnaSupport); S1_show = 1; } } if (S1_show AND R1_show) { SR = Prec((1-(S1/R1))*100,2); } } // END SCRIPT UNTUK SUPPORT / RESISTANT _SECTION_END(); |
Leave A Comment