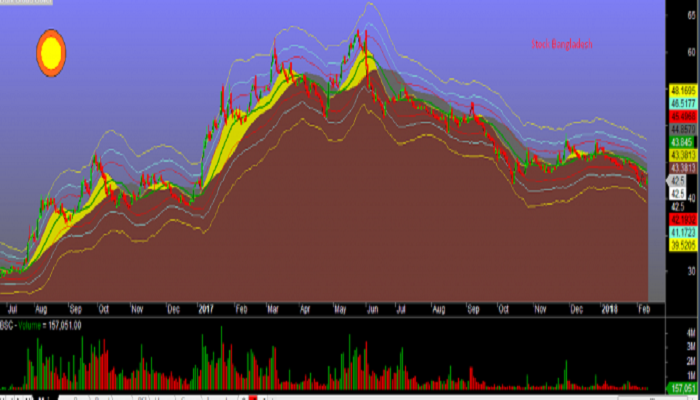
SUN AND CLOUD for Amibroker AFL –
SUN AND CLOUD for Amibroker AFL is saying everything, Formula for intraday traders. But i would say that this afl for all those people who want to trade again n again n again daily for small profits, that means this afl formula is for scalpers. So see first trend in max timeframes, and trade on that . for small profits with small stoploss. So scalp the trend with the formula.
HERE IS THE SUN AND CLOUD for Amibroker AFL
|
1 2 3 4 5 6 7 8 9 10 11 12 13 14 15 16 17 18 19 20 21 22 23 24 25 26 27 28 29 30 31 32 33 34 35 36 37 38 39 40 41 42 43 44 45 46 47 48 49 50 51 52 53 54 55 56 57 58 59 60 61 62 63 64 65 66 67 68 69 70 71 72 73 74 75 |
_SECTION_BEGIN("Price 206"); // Bollinger Fibonacci Bands // // www.stockbangladesh.com // // Mehedi Arafat // /* as used in the VT trading platform - see outline of FX trading system by mezarashii on Moneytec http://www.moneytec.com/forums/_showthread/_threadid-11630/_s- */ GraphXSpace = 3; per = Param("Period",20,10,55,1); TH =IIf(Ref(C,-1) > H,Ref(C,-1),H); TL=IIf(Ref(C,-1) < L,Ref(C,-1),L); TR = TH-TL; TRa= Wilders(TR,per); UpperBand3 =MA( C, per) + ( 4.2360 * TRa); UpperBand2=MA( C, per) + ( 2.6180 * TRa); UpperBand1=MA( C, per) + ( 1.6180 * TRa); MidPoint=MA(C, per); LowerBand1=MA( C, per) - ( 1.6180 * TRa); LowerBand2=MA( C, per) - ( 2.6180 * TRa); LowerBand3=MA( C, per) - ( 4.2360 * TRa); Plot(MidPoint,"",colorGreen,4); Plot(UpperBand1,"",colorRed,1); Plot(LowerBand1,"",colorRed,1); Plot(UpperBand2,"",colorAqua,1); Plot(LowerBand2,"",colorAqua,1); Plot(UpperBand3,"",colorYellow,1); Plot(LowerBand3,"",colorYellow,1); PlotOHLC(O,H,L,C,"",colorWhite,64); _SECTION_END(); _SECTION_BEGIN("Sun & Cloud_i"); // by boufalo 13-1-2011 // Sun & Cloud System based on idea of ICHIMOKU CHART /* Reading of the chart, 1.for long term investors, a.Bullish when you see the sun(Yellow zone) b.Bearish when you see the dark cloud(Black zone) c.Turning point from bullish to bearish:When red line break into the yellow zone. d.Turning point from bearish to bullish: When red line break through the dark cloud. 2.for short term trading, reading the changes between the white line and the red line */ Long2 =EMA( ( HHV( H, 20 ) + LLV( L, 20) )/2,20); Long1 =EMA( ( HHV( H, 5 ) + LLV( L, 5) )/2,10); K=(H+2*C+L)/4; Z= ( HHV( H, 3 ) + LLV( L, 3) )/2 ; SP=IIf(K>=Z*1.05,1.10*Z,IIf(K<Z*1.05 AND K>=Z,1.0*Z,IIf(K<Z,0.9*Z,0.9*Z))); M=IIf(Long1>long2,Long2,Long1); Plot(C,"Close",colorBlack,styleLine); SetChartBkGradientFill( ParamColor("Sky",ColorRGB( 128, 128, 255 )),ParamColor("Sky lower", colorGrey40),ParamColor("Text", colorLightGrey)); PlotOHLC( Long1 , Long1 , m, Long1 ," ", ParamColor("Left Side",ColorRGB( 213, 213, 0 )),styleCloud ); PlotOHLC( Long2 , Long2 , m, Long2 ," ", colorGrey40,styleCloud ); PlotOHLC( Long1 , Long1 , m, Long1 ," ", ParamColor("Land",ColorRGB( 115, 61, 54 )),styleArea ); Title=Name() + " { Sun & Cloud } : \n"+WriteIf(Long1>long2,"Rising Sun","Dark Cloud Cover"); GfxSelectSolidBrush(colorOrange); GfxCircle( 100, 85 , 28 ); GfxSelectSolidBrush(colorYellow); GfxSelectPen( colorRed ); GfxCircle( 100, 85 , 20 ); _SECTION_END(); |


Leave A Comment