
RSI WITH OVERBOUGHT & OVERSOLD COLOURED FOR AMIBROKER AFL
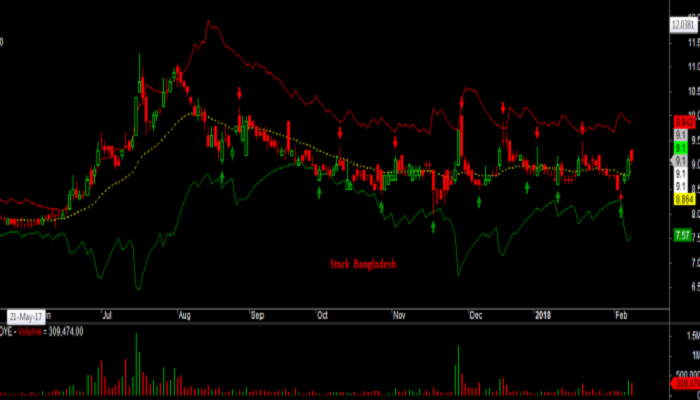
RSI – With Overbought & Oversold coloured for Amibroker AFL is saying everything, Formula for intraday traders. But i would say that this afl for all those people who want to trade again n again n again daily for small profits, that means this afl formula is for scalpers. So see first trend in max timeframes, and trade on that . for small profits with small stoploss. So scalp the trend with the formula.
HERE IS THE RSI With Overbought & Oversold coloured for Amibroker AFL
|
1 2 3 4 5 6 7 8 9 10 11 12 13 14 15 16 17 18 19 20 21 |
//www.stockbangladesh.com //Mehedi Arafat _SECTION_BEGIN("RSI"); SetChartOptions(0,0,ChartGrid30|ChartGrid70,0,100); periods = Param( "Periods", 14, 1, 200, 1 ); z = RSI( periods); RSILineColor = ParamColor("RSI Line Color",ColorRGB(127,0,83)); RSIOverboughtColor = ParamColor("RSI Overbought Color",ColorRGB(127,0,83)); RSIOversoldColor = ParamColor("RSI Oversold Color",colorRed); Plot( z, _DEFAULT_NAME(), RSILineColor , styleLine ); Plot( 50, _DEFAULT_NAME(), RSILineColor , styleDashed|styleNoTitle ); Plot( 70, _DEFAULT_NAME(), RSILineColor , styleLine|styleNoTitle ); Plot( 30, _DEFAULT_NAME(), RSILineColor , styleLine|styleNoTitle ); PlotOHLC(z,z,50,z,"",IIf(z>50,RSIOverboughtColor,RSIOversoldColor),styleCloud|styleClipMinMax,30,70); _SECTION_END(); |
Leave A Comment