
Intraday Profit generator using RSI and ADX for Amibroker AFL is saying everything, Formula for intraday traders. But i would say that this afl for all those people who want to trade again n again n again daily for small profits, that means this afl formula is for scalpers. So see first trend in max timeframes, and trade on that . for small profits with small stoploss. So scalp the trend with the formula.
HERE IS Intraday Profit generator using RSI and ADX for Amibroker AFL
|
1 2 3 4 5 6 7 8 9 10 11 12 13 14 15 16 17 18 19 20 21 22 23 24 25 26 27 28 29 30 31 32 33 34 35 36 37 38 39 40 41 42 43 44 45 46 47 48 49 50 51 52 53 54 55 56 57 58 59 60 61 62 63 |
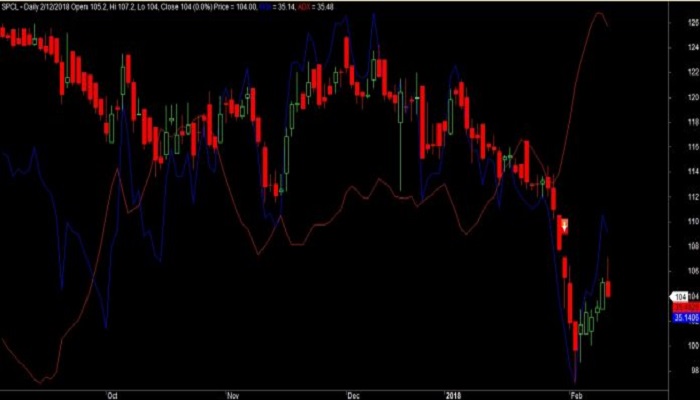
//------------------------------------------------------ // // Formula Name: Nifty Intraday Strategy using RSI and ADX //------------------------------------------------------ _SECTION_BEGIN("Nifty Intraday Strategy"); SetTradeDelays( 1, 1, 1, 1 ); SetOption( "InitialEquity", 200000); SetOption("FuturesMode" ,True); SetOption("MinShares",1); SetOption("CommissionMode",2); SetOption("CommissionAmount",50); SetOption("AccountMargin",10); SetOption("RefreshWhenCompleted",True); SetPositionSize(150,spsShares); //Use this for fixed position size //SetPositionSize(80,spsPercentOfEquity); //Use this for position size as a percent of Equity SetOption( "AllowPositionShrinking", True ); BuyPrice=Open; SellPrice=Open; ShortPrice=Open; CoverPrice=Open; SetChartOptions(0,chartShowArrows|chartShowDates); _N(Title = StrFormat("{{NAME}} - {{INTERVAL}} {{DATE}} Open %g, Hi %g, Lo %g, Close %g (%.1f%%) {{VALUES}}", O, H, L, C )); Plot( Close, "Price", colorWhite, styleCandle ); RSIPeriods=17; ADXPeriods=14; Buy=RSI(RSIPeriods)>=75 AND ADX(ADXPeriods)>25; Short=RSI(RSIPeriods)<=25 AND ADX(ADXPeriods)>25 ; Buy=ExRem(Buy,Short); Short=ExRem(Short,Buy); Sell=Short OR TimeNum()==151500; Cover=Buy OR TimeNum()==151500; StopLoss=0.5; ApplyStop(Type=0,Mode=1,Amount=StopLoss); Plot( RSI(RSIPeriods), "RSI", color=colorBlue, ParamStyle( "Style", styleOwnScale) ); Plot( ADX(ADXPeriods), "ADX", color=colorRed, ParamStyle( "Style", styleOwnScale) ); /* Plot Buy and Sell Signal Arrows */ PlotShapes(IIf(Buy, shapeSquare, shapeNone),colorGreen, 0, L, Offset=-40); PlotShapes(IIf(Buy, shapeSquare, shapeNone),colorLime, 0,L, Offset=-50); PlotShapes(IIf(Buy, shapeUpArrow, shapeNone),colorWhite, 0,L, Offset=-45); PlotShapes(IIf(Cover, shapeSquare, shapeNone),colorGreen, 0, L, Offset=-40); PlotShapes(IIf(Cover, shapeSquare, shapeNone),colorLime, 0,L, Offset=-50); PlotShapes(IIf(Cover, shapeUpArrow, shapeNone),colorWhite, 0,L, Offset=-45); PlotShapes(IIf(Sell, shapeSquare, shapeNone),colorRed, 0, H, Offset=40); PlotShapes(IIf(Sell, shapeSquare, shapeNone),colorOrange, 0,H, Offset=50); PlotShapes(IIf(Sell, shapeDownArrow, shapeNone),colorWhite, 0,H, Offset=-45); PlotShapes(IIf(Short, shapeSquare, shapeNone),colorRed, 0, H, Offset=40); PlotShapes(IIf(Short, shapeSquare, shapeNone),colorOrange, 0,H, Offset=50); PlotShapes(IIf(Short, shapeDownArrow, shapeNone),colorWhite, 0,H, Offset=-45); _SECTION_END(); |
Leave A Comment