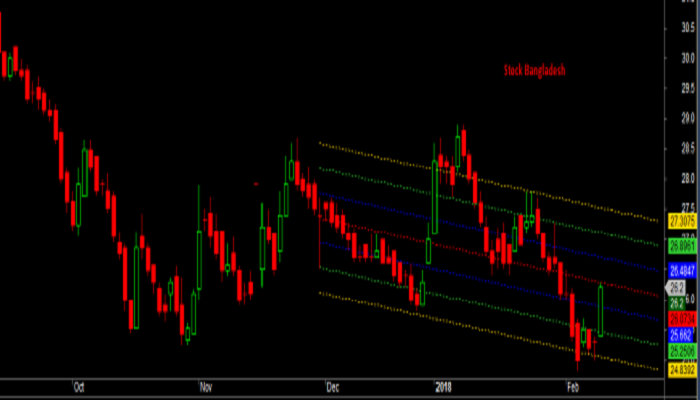
Interactive Linear Regression Channel for Amibroker AFL –
Interactive Linear Regression Channel for Amibroker AFL is saying everything, Formula for intraday traders. But i would say that this afl for all those people who want to trade again n again n again daily for small profits, that means this afl formula is for scalpers. So see first trend in max timeframes, and trade on that . for small profits with small stoploss. So scalp the trend with the formula.
HERE IS THE Interactive Linear Regression Channel for Amibroker AFL
|
1 2 3 4 5 6 7 8 9 10 11 12 13 14 15 16 17 18 19 20 21 22 23 24 25 26 27 28 29 30 31 32 33 34 35 36 37 38 39 40 41 42 43 44 45 46 47 48 49 50 51 52 53 |
//www.stockbangladesh.com //Mehedi Arafat SetChartBkColor(ParamColor("Background Color",colorBlack)); SetChartOptions(0,chartShowDates); SetBarFillColor(IIf(C>O,ParamColor("Candle UP Color",colorGreen),IIf(C<=O,ParamColor("Candle Down Color",colorRed),colorLightGrey))); Plot(C,"Price",IIf(C>O,ParamColor("Wick UP Color",colorDarkGreen),IIf(C<=O,ParamColor("Wick Down Color",colorDarkRed),colorLightGrey)),64,0,0,0,0); _SECTION_BEGIN("Linear Reg Channel"); //Plot(Close, "", 55, GetPriceStyle()); P = ParamField("Price field", -1); Daysback = Param("Period for Linear Regression Channel", 50, 1, 300, 1); SDP1 = Param("Standard Deviation 1", 1.0, 0, 6, 0.05); SDP2 = Param("Standard Deviation 2", 2.0, 0, 6, 0.05); SDP3 = Param("Standard Deviation 3", 3.0, 0, 6, 0.05); ext = Param("extend Linear Regression Channel", 15, 0, 50, 1); shift = Param("Look back period", 0, 0, 240, 1); Collg = ParamColor("Color Linear Reg Line", colorRed); Colsd1 = ParamColor("Color StDev 1", colorBlue); Colsd2 = ParamColor("Color StDev 2", colorLime); Colsd3 = ParamColor("Color StDev 3", colorGold); SDP1 = SDP1/2; SDP2 = SDP2/2; SDP3 = SDP3/2; pds = Daysback; x = BarIndex() + 1; sx = SelectedValue(x)-shift; aa = SelectedValue(Ref(LinRegIntercept(P, pds), -shift)); bb = SelectedValue(Ref(LinRegSlope(P, pds), -shift)); StDev0 = StDev(P, pds); fd1 = SelectedValue(Ref(SDP1 * StDev0, -shift) ); fd2 = SelectedValue(Ref(SDP2 * StDev0, -shift) ); fd3 = SelectedValue(Ref(SDP3 * StDev0, -shift) ); ys = SelectedValue(ValueWhen(x, aa, 1)); yi = SelectedValue(ValueWhen(x, bb, 1)); xs = sx - pds; d = ext;//Shift Line Right xe = xs + pds + d; ye = ys + yi * (xe - xs); sty = 1|32|2048; Plot(LineArray(xs-d,ys,xe-d,ye,1),"",Collg,sty,0,0,d); Plot(LineArray(xs-d,ys-fd1,xe-d,ye-fd1,1),"",Colsd1,sty,0,0,d); Plot(LineArray(xs-d,ys+fd1,xe-d,ye+fd1,1),"",Colsd1,sty,0,0,d); Plot(LineArray(xs-d,ys-fd2,xe-d,ye-fd2,1),"",Colsd2,sty,0,0,d); Plot(LineArray(xs-d,ys+fd2,xe-d,ye+fd2,1),"",Colsd2,sty,0,0,d); Plot(LineArray(xs-d,ys-fd3,xe-d,ye-fd3,1),"",Colsd3,sty,0,0,d); Plot(LineArray(xs-d,ys+fd3,xe-d,ye+fd3,1),"",Colsd3,sty,0,0,d); _SECTION_END(); |


Leave A Comment