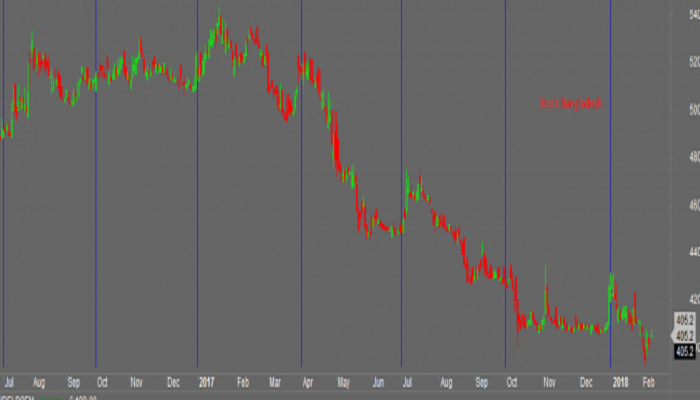
Grid – Month Week Quarter for Amibroker AFL –
Grid – Month Week Quarter for Amibroker AFL is saying everything, Formula for intraday traders. But i would say that this afl for all those people who want to trade again n again n again daily for small profits, that means this afl formula is for scalpers. So see first trend in max timeframes, and trade on that . for small profits with small stoploss. So scalp the trend with the formula.
HERE IS THE Grid – Month Week Quarter for Amibroker AFL
|
1 2 3 4 5 6 7 8 9 10 11 12 13 14 15 16 17 18 19 20 21 22 23 24 25 26 27 28 29 30 31 32 33 34 35 |
_SECTION_BEGIN("Price"); SetChartOptions(0,chartShowArrows|chartShowDates); _N(Title = StrFormat("{{NAME}} - {{INTERVAL}} {{DATE}} Open %g, Hi %g, Lo %g, Close %g (%.1f%%) {{VALUES}}", O, H, L, C, SelectedValue( ROC( C, 1 ) ) )); Plot( C, "Close", ParamColor("Color", colorDefault ), styleNoTitle | ParamStyle("Style") | GetPriceStyle() ); _SECTION_END(); _SECTION_BEGIN("Grid_Month_Week_Quarter"); ShowGrid = ParamList("Grid", "Off|Grid_Quarter|Grid_Week|Grid_Month|Grid_year",1); color_Grid = ParamColor("Color_Grid",colorBlue); Style_Grid = ParamStyle("Style_Grid ",styleHistogram|styleNoLabel|styleNoRescale|styleOwnScale,maskAll); switch (ShowGrid ) { case "Grid_Quarter": LastDayofQuarter = Month() != Ref(Month(), 1) AND (Month() == 3 OR Month() == 6 OR Month() == 9 OR Month() == 12); Last_Quarter = IIf(Ref(LastDayofQuarter,-1), 1, 0); Plot(Last_Quarter, "", color_Grid, Style_Grid); break; case "Grid_Month": Grid_Month = IIf(Month() != Ref(Month(),-1), 1, 0); Plot(Grid_Month, "", color_Grid, Style_Grid ); break; case "Grid_year": Grid_year = IIf(Year() != Ref(Year(),-1), 1, 0); Plot(Grid_year, "", color_Grid, Style_Grid ); break; case "Grid_Week": Grid_Week = IIf(DayOfWeek() < Ref(DayOfWeek(), -1), 1, 0); Plot(Grid_Week, "", color_Grid, Style_Grid ); break; case "Off": 0; break; } Plot(C,"",colorBlack,styleCandle); _SECTION_END(); |


Leave A Comment