
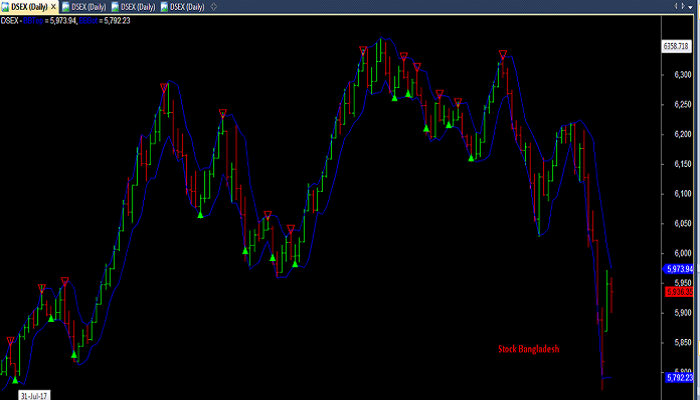
Bollinger Band ZigZag Indicator 4 for Amibroker AFL –
Bollinger Band ZigZag Indicator 4 for Amibroker AFL is saying everything, Formula for intraday traders. But i would say that this afl for all those people who want to trade again n again n again daily for small profits, that means this afl formula is for scalpers. So see first trend in max timeframes, and trade on that . for small profits with small stoploss. So scalp the trend with the formula.
HERE IS Bollinger Band ZigZag Indicator 4 for Amibroker AFL
|
1 2 3 4 5 6 7 8 9 10 11 12 13 14 15 16 17 18 19 20 21 22 23 24 25 26 27 28 29 30 31 32 33 34 35 36 37 38 39 40 41 42 43 44 45 46 47 48 49 50 51 52 53 54 55 56 57 58 59 60 61 62 63 64 65 66 67 68 69 70 71 72 73 74 75 76 77 78 79 80 81 82 83 84 85 86 87 88 89 90 91 92 93 94 95 96 97 |
// Mehedi Arafat _SECTION_BEGIN("Bollinger Band ZigZag Indicator"); function ParamOptimize( description, defaultVal, minv, maxv, step ) { return Optimize(description, Param(description,defaultVal, minv, maxv, step ), minv, maxv, step ); } BlankBars = 10; // Set to the number set in preferences Buy = Sell = Short = Cover = Pos = 0; Periods = ParamOptimize( "Periods", 3, 3, 30, 1 ); Width = ParamOptimize( "Width", 1, 0, 5, 0.1 ); BBTOp = BBandTop( H, Periods, Width ); // Note H is used instead of the tradional C BBBot = BBandBot( L, Periods, Width ); // Note L is used instead of the tradional C Plot( BBTop, "BBTop", colorBlue, styleLine ); Plot( BBBOt, "BBBot", colorBlue, styleLine ); Plot( C, "", 1, 128 ); BI = BarIndex(); start = Status( "firstvisiblebarindex" ) - BI[0] - BlankBars; end = Status( "lastvisiblebarindex" ) - BI[0] - BlankBars; LBI = LastValue( BarIndex() ); for ( b = LBI; b > Periods; b-- ) { if ( L[b] <= BBBot[b] AND pos <= 0 ) { pos = 1; Buy[b] = True; BuyPrice[b] = BBBot[b]; } else if ( H[b] >= BBTop[b] AND Pos >= 0 ) { Pos = -1; Sell[b] = True; SellPrice[b] = BBTop[b]; } } Short = Sell; ShortPrice = SellPrice; Cover = Buy; CoverPrice = BuyPrice; Eq = Equity( 1 ); if ( ParamToggle( "Equity", "HIDE|SHOW", 0 ) ) Plot( Eq, "", colorYellow, 1 | styleOwnScale ); ShowTriangles = ParamToggle( "Arrows", "HIDE|SHOW", 1 ); if ( showTriangles ) { PlotShapes( IIf( Buy, shapeSmallUpTriangle, shapeNone ), 5, 0, BuyPrice, 0 ); PlotShapes( IIf( Sell, shapeHollowDownTriangle, shapeNone ), 4, 0, SellPrice, 0 ); PlotShapes( IIf( Cover, shapeHollowUpTriangle, shapeNone ), 5, 0, CoverPrice, 0 ); PlotShapes( IIf( Short, shapeSmallDownTriangle, shapeNone ), 4, 0, ShortPrice, 0 ); } if ( ParamToggle( "Trade Lines", "HIDE|SHOW", 0 ) ) { Sig = Buy OR Short; signum = Cum( Sig ); y0 = 0; y1 = C[0]; TPrice = C; Shortcolor = LongColor = colorWhite; for ( b = start ;b < end ;b++ ) { if ( Sig[b] ) { x0 = y0; x1 = y1; y0 = b; if ( Buy[b] ) { y1 = BuyPrice[b]; Color = Shortcolor; } else if ( Short[b] ) { y1 = ShortPrice[b]; Color = Longcolor; } if( SigNum[b] > 1 ) Plot( LineArray( x0, x1, y0, y1 ), "", Color, 1 | styleThick ); } } } _SECTION_END(); |
Leave A Comment